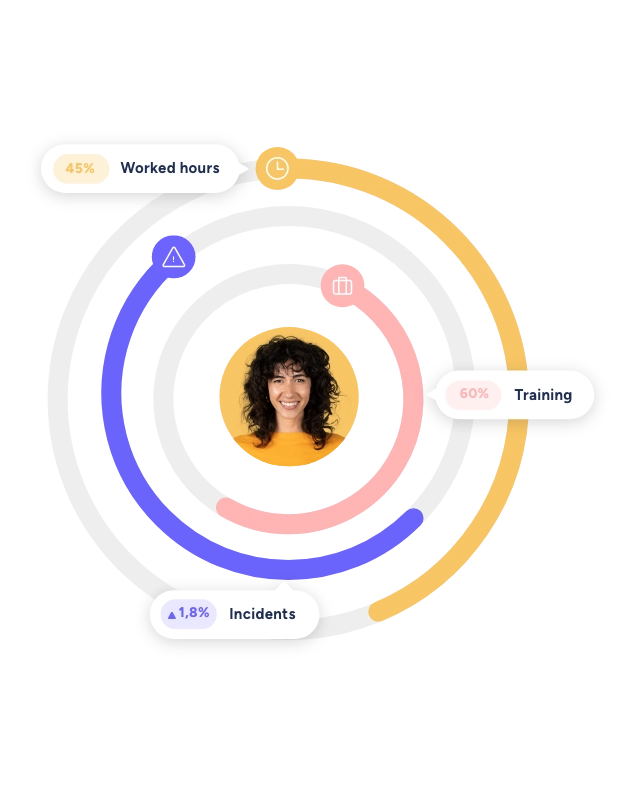
People Analytics revolutionizes your company's Human Resources strategies
-
Measure trends, patterns and behaviors
Store your employee’s data.
-
Access information through visual and intuitive graphics
Make decisions based on data and statistics from the organizational chart.
-
Optimize data collection and decision-making
Offer your team a more complete work experience.
Discover the potential of People Analytics
-
1
Improve the work environment
Extract data from situations that promote a good environment among colleagues. -
2
Boost engagement
Get your team involved and committed. -
3
Avoid excessive turnover
Meet the needs of your employees to retain talent. -
4
Get ahead of burnout
Make decisions that help increase your employee's well-being.
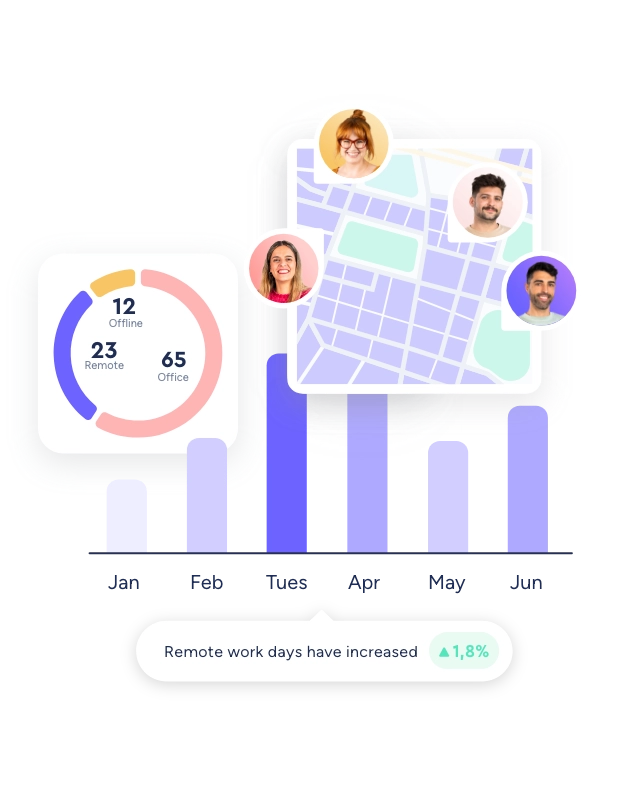
Keep remote workers aligned and increase their productivity
-
Strengthen teamwork despite distance
Meet your employees’ needs and facilitate their daily life.
-
Measure work from home productivity
Analyze the days that employees telework the most and what profiles opt for this option.
-
Real-time information
Select the information you are interested in before making important decisions.
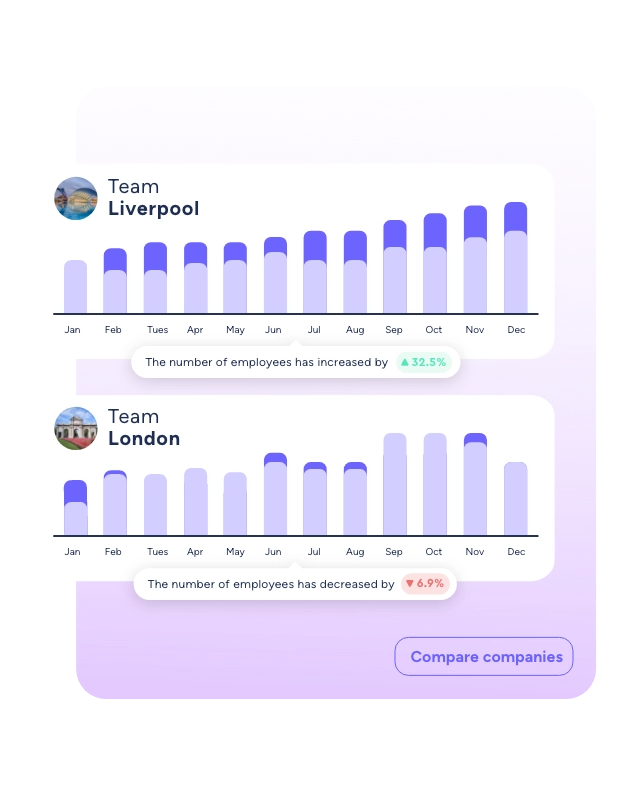
Compare data across your companies, workplaces and departments
-
Crosscheck information and broaden your strategic vision
With People Analytics you can at a glance compare the development of the companies within your business group.
-
Extract data and manage the evolution of workplaces
Know and contrast the dynamics and growth rate of your company’s locations.
-
Analyze in detail and respond to the needs of your team
Examine the graphs by department and make the best decisions for each team.
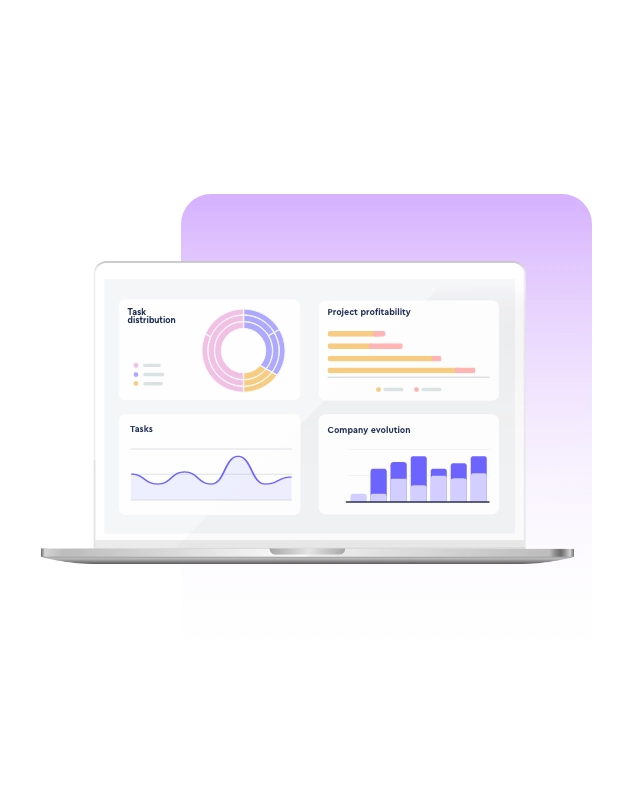
Analyze the profitability of your projects
-
Draw conclusions
From visual and easy-to-understand graphs
-
Data segmented
By tasks, projects and departments
-
Valuable information
About your team and its objectives
-
Make decisions
To streamline the production process
Visualize the invisible with People Analytics
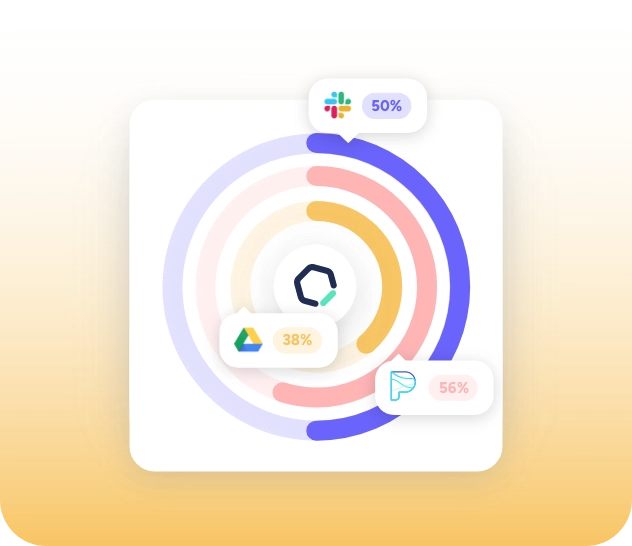
Cross data with external platforms
Know the use percentages of other integrated software
Valuable information on strategic actions
Draw conclusions and make decisions
Labor statistics
Get real-time data such as turnover rate, contract types, generational average of the workforce, and much more.
Compare and draw conclusions
Compare between companies, centers and departments.
 USA
USA Mexico
 Colombia
 Costa Rica
 Chile
Chile Peru
Peru Brazil
 Spain
Spain France
 UK
UK Italy
Italy Germany
 Netherlands
 Portugal